
The portfolio insights your broker doesn't give you
Works with every major US broker
Sharpe ratios, drawdown analysis, benchmark comparisons, monthly heatmaps — across Alpaca, Interactive Brokers, Fidelity, Robinhood, Schwab, E*TRADE, Webull, Public, and Vanguard.
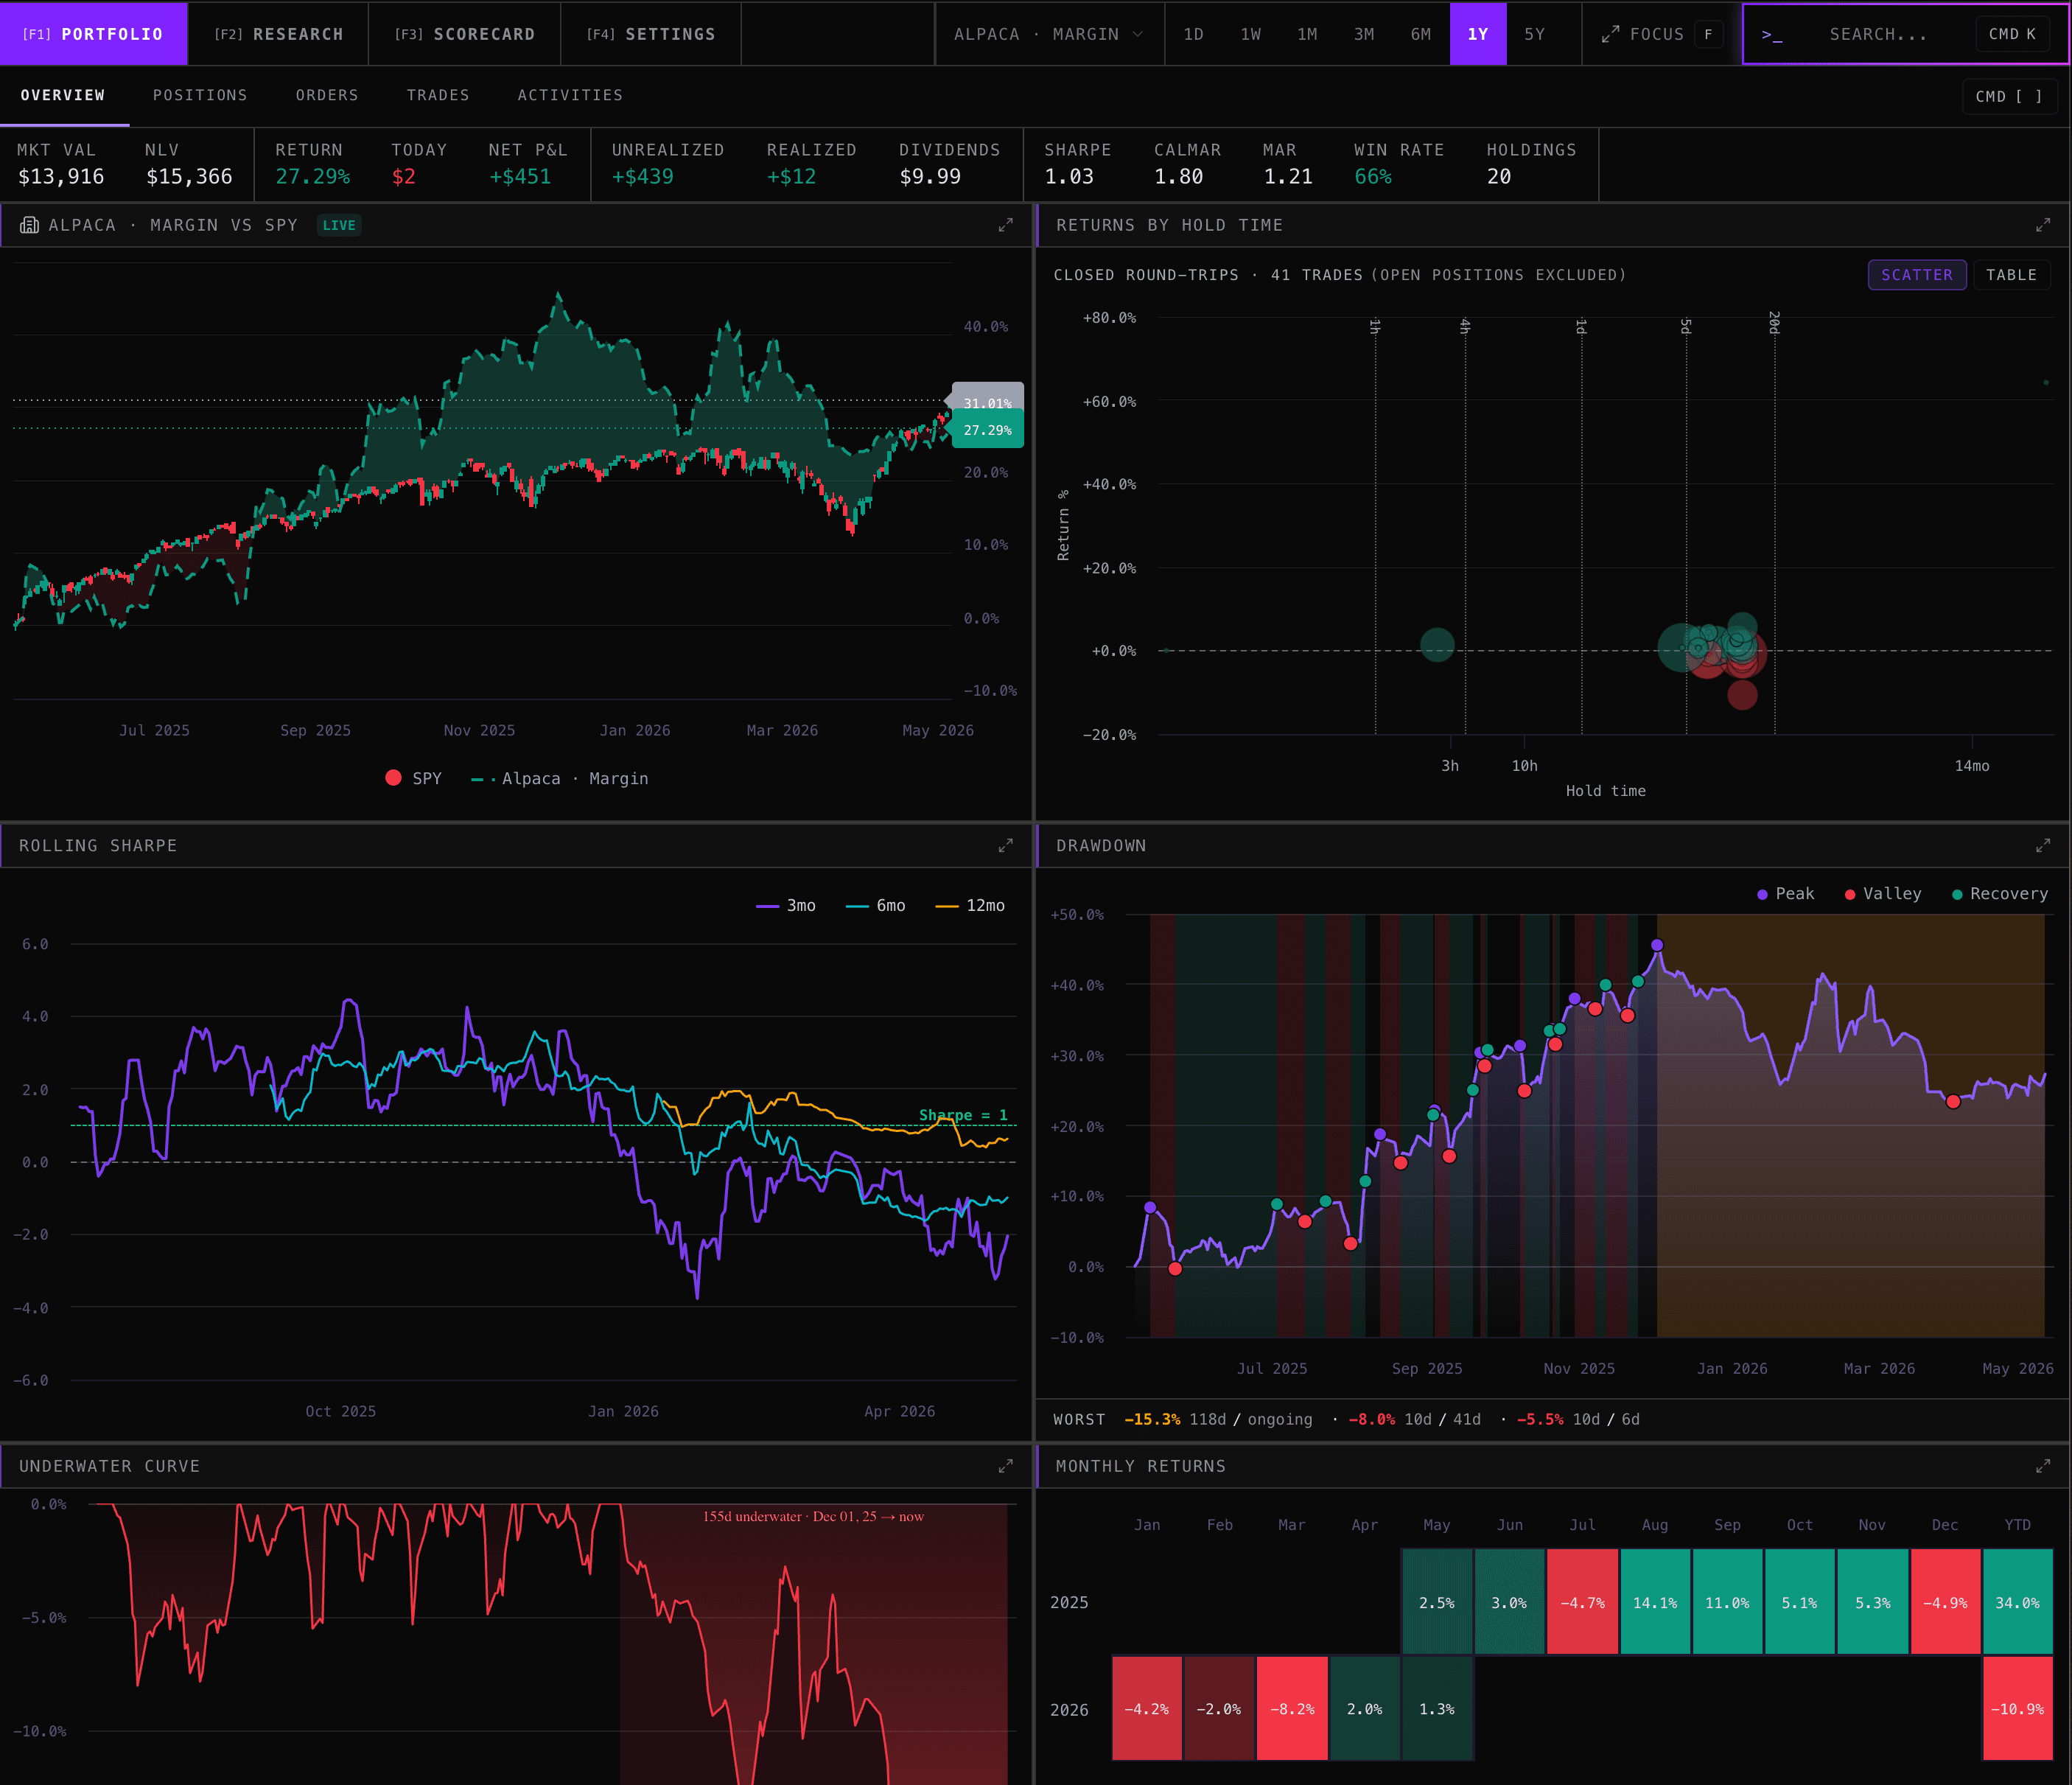
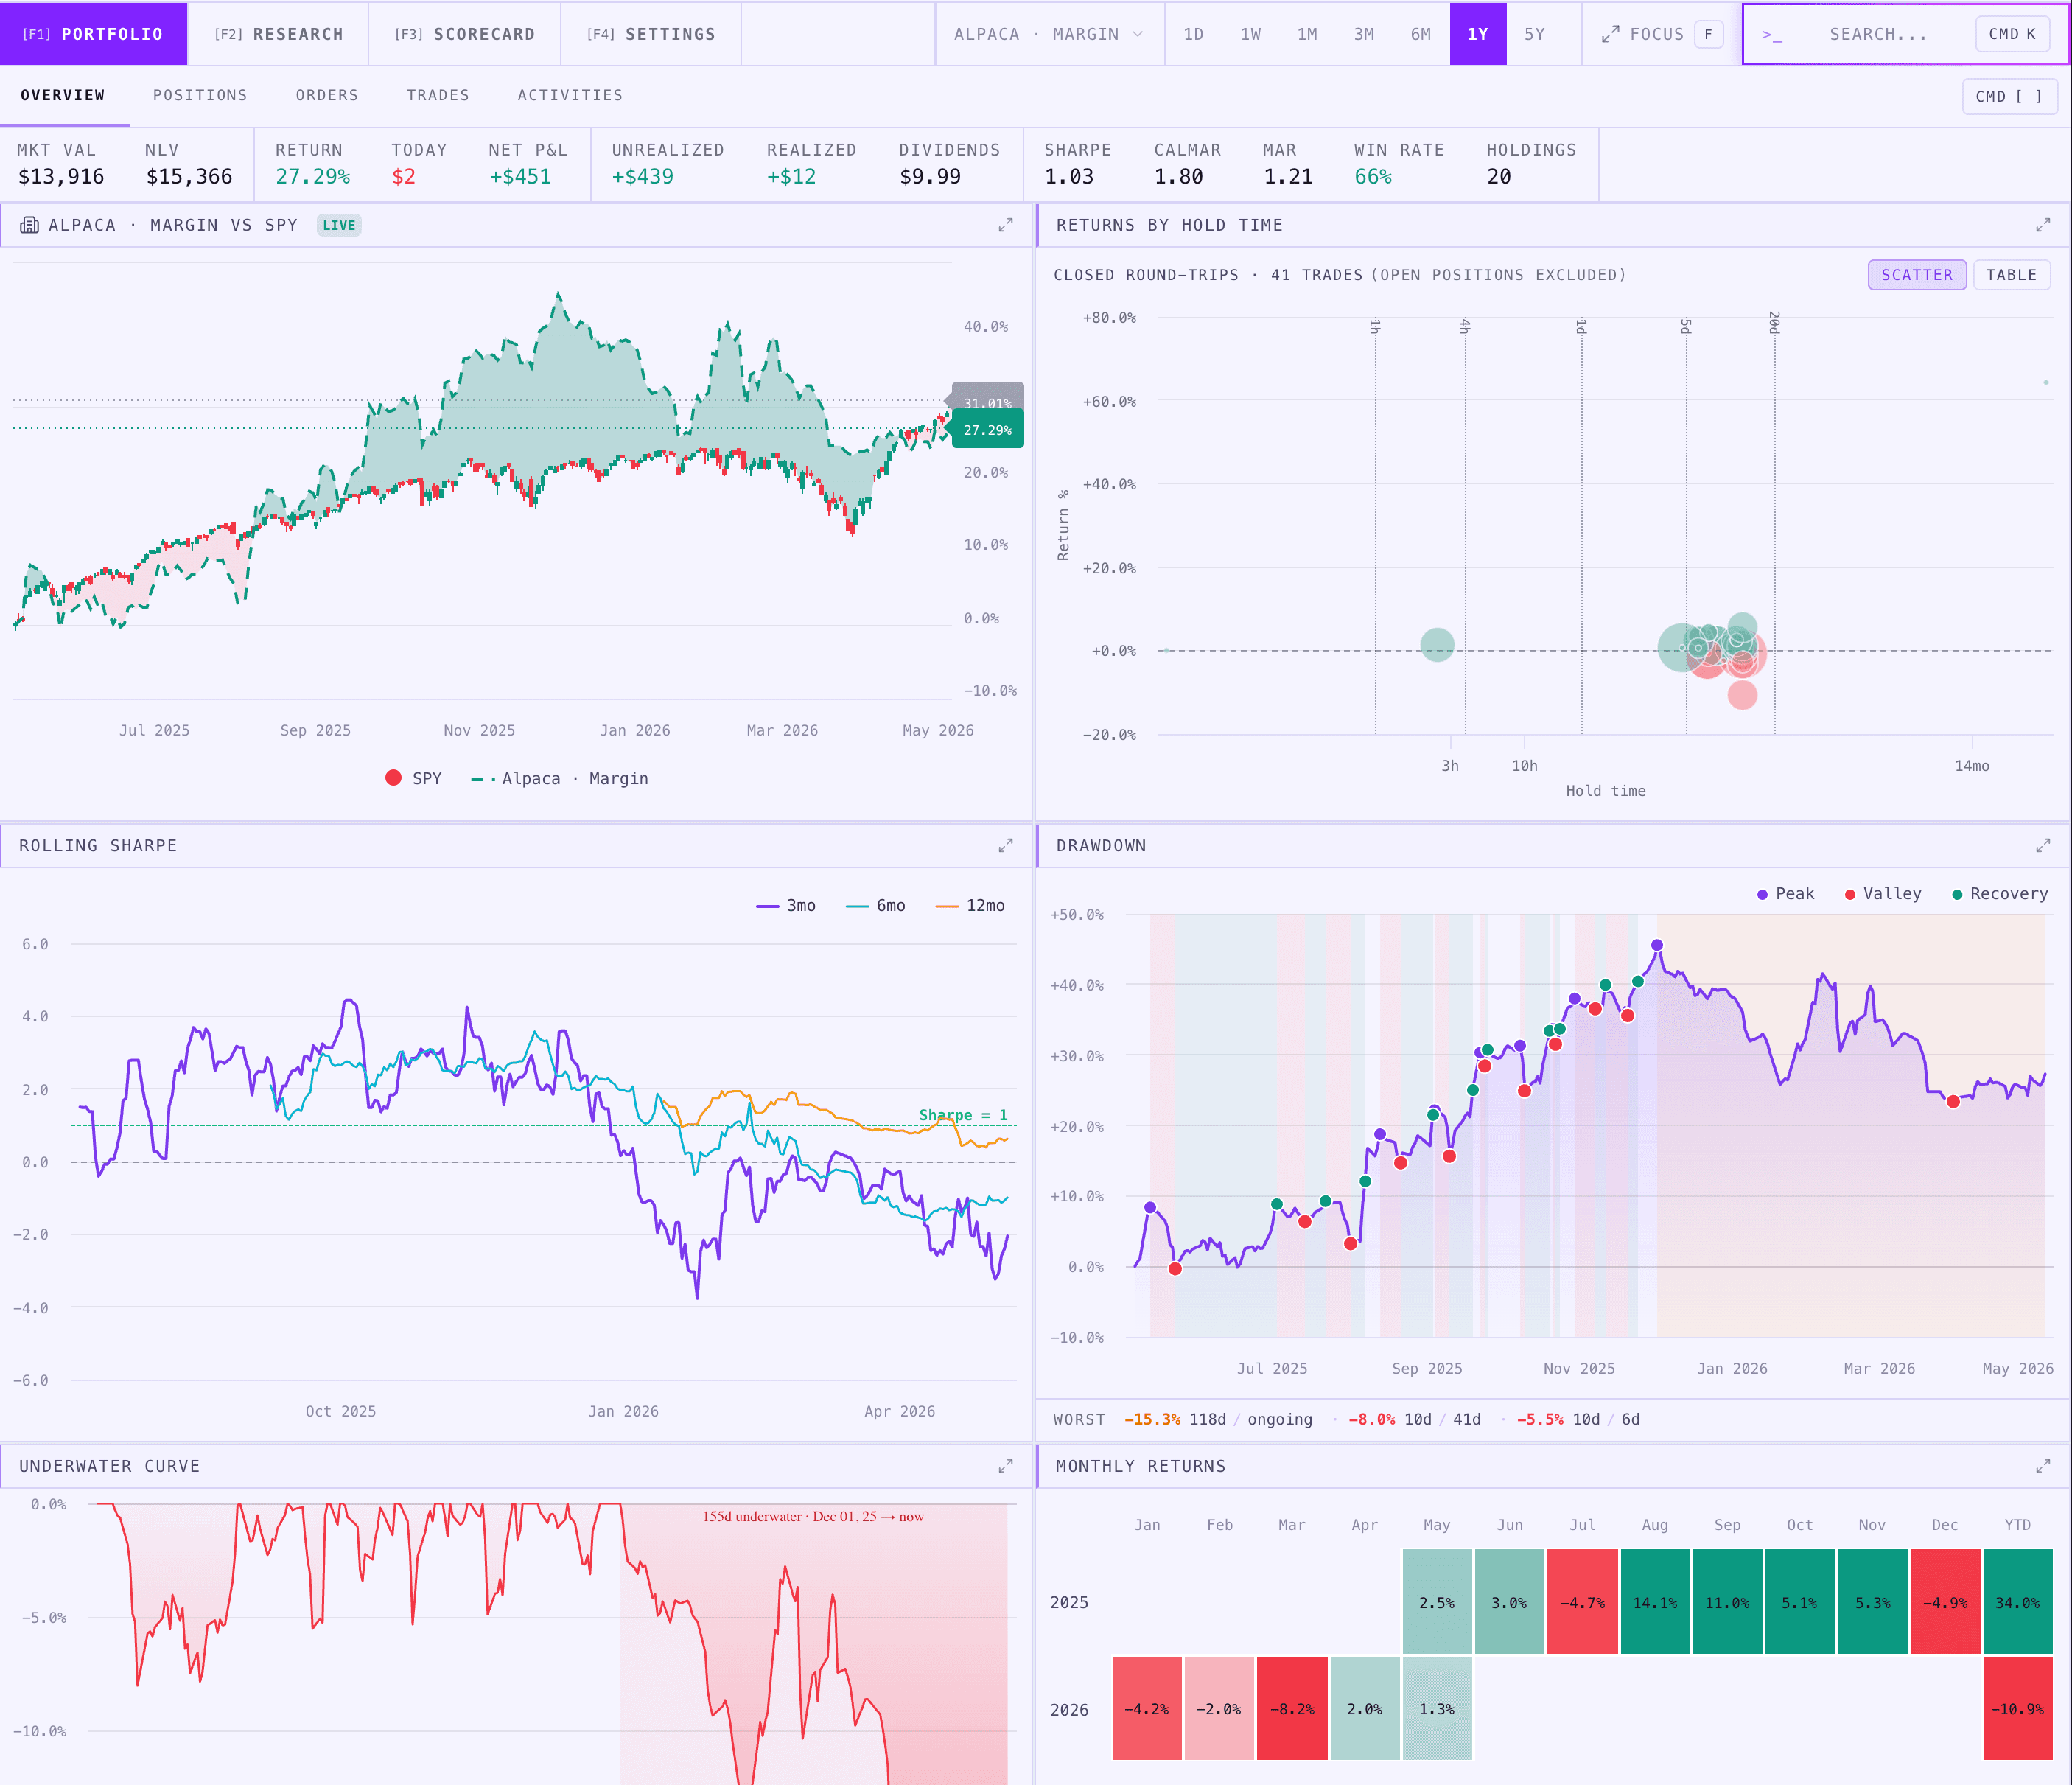
Everything your broker's dashboard is missing
Brokers give you raw equity and P&L data. We turn it into actionable intelligence.
Sharpe & Sortino Ratios
Measure your risk-adjusted returns with industry-standard metrics your broker doesn't provide.
Max Drawdown Analysis
Track peak-to-trough declines with recovery timelines so you understand your worst-case scenarios.
Benchmark Comparisons
Compare your portfolio against SPY, QQQ, and other benchmarks to measure your true alpha.
TWR & IRR Calculations
Time-weighted and money-weighted returns that account for deposits and withdrawals accurately.
Monthly Returns Heatmap
Visualize performance patterns with a color-coded month-by-month breakdown of your returns.
Realized vs Unrealized P&L
Separate closed-position gains from open positions to understand your actual locked-in performance.
Win Rate & Profit Factor
Know your edge — track win/loss rates and how much you make on winners vs. losers.
Dividend & Income Tracking
Automatically track dividends and income distributions alongside your trading returns.
See exactly where you stand
Candlestick benchmark overlays and live sector treemaps give you the full picture at a glance.
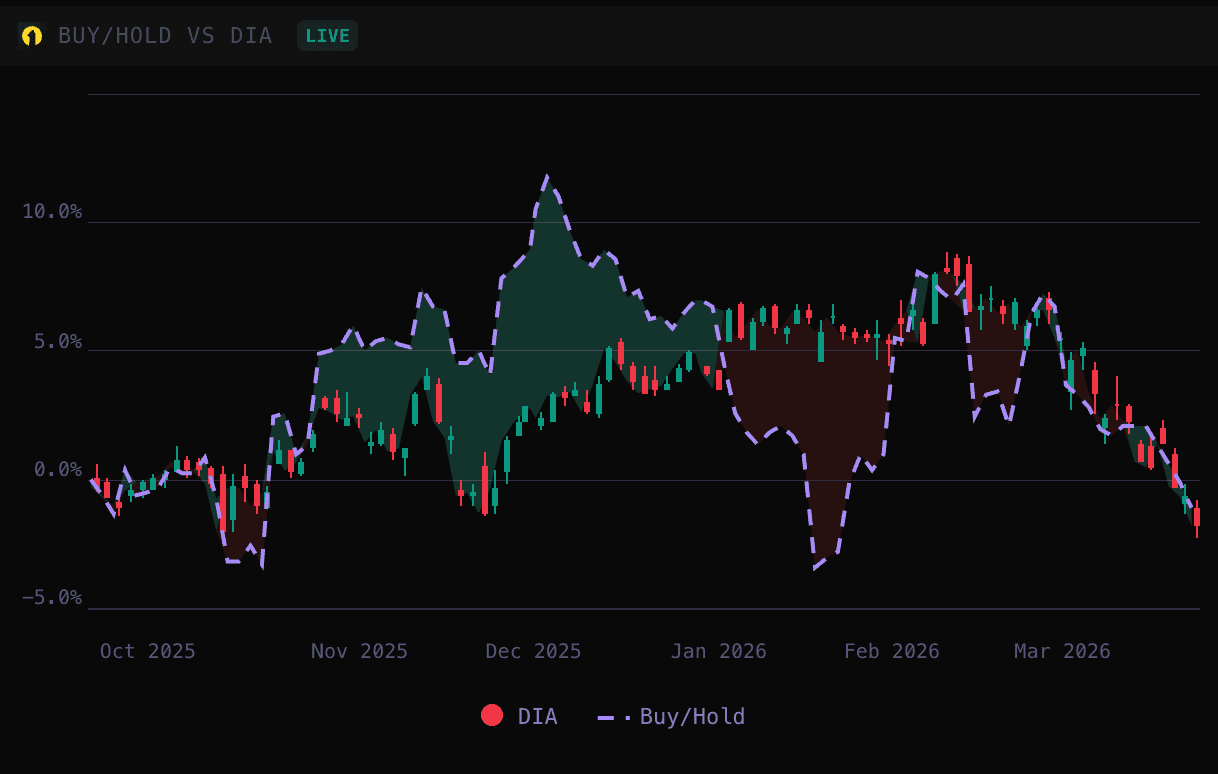
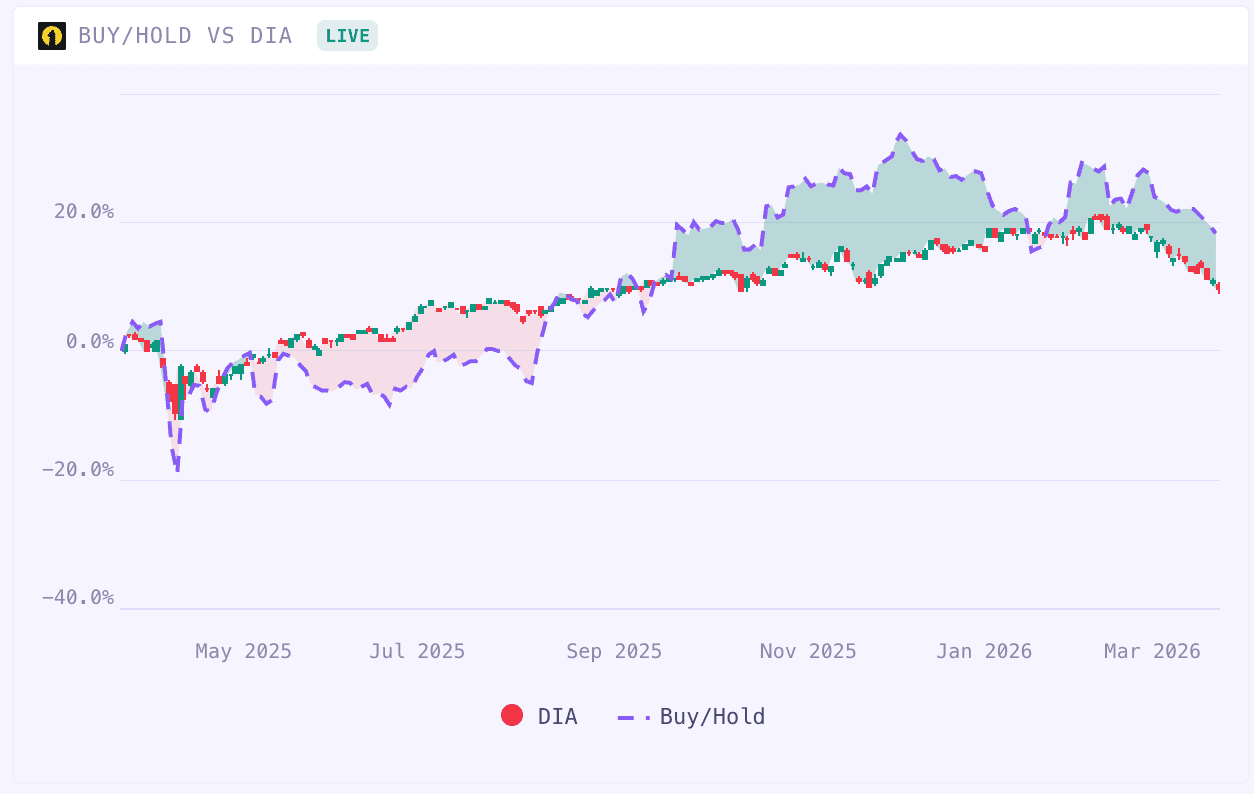
Benchmark Overlay
Candlestick charts with green/red alpha shading show exactly when you're beating the market.
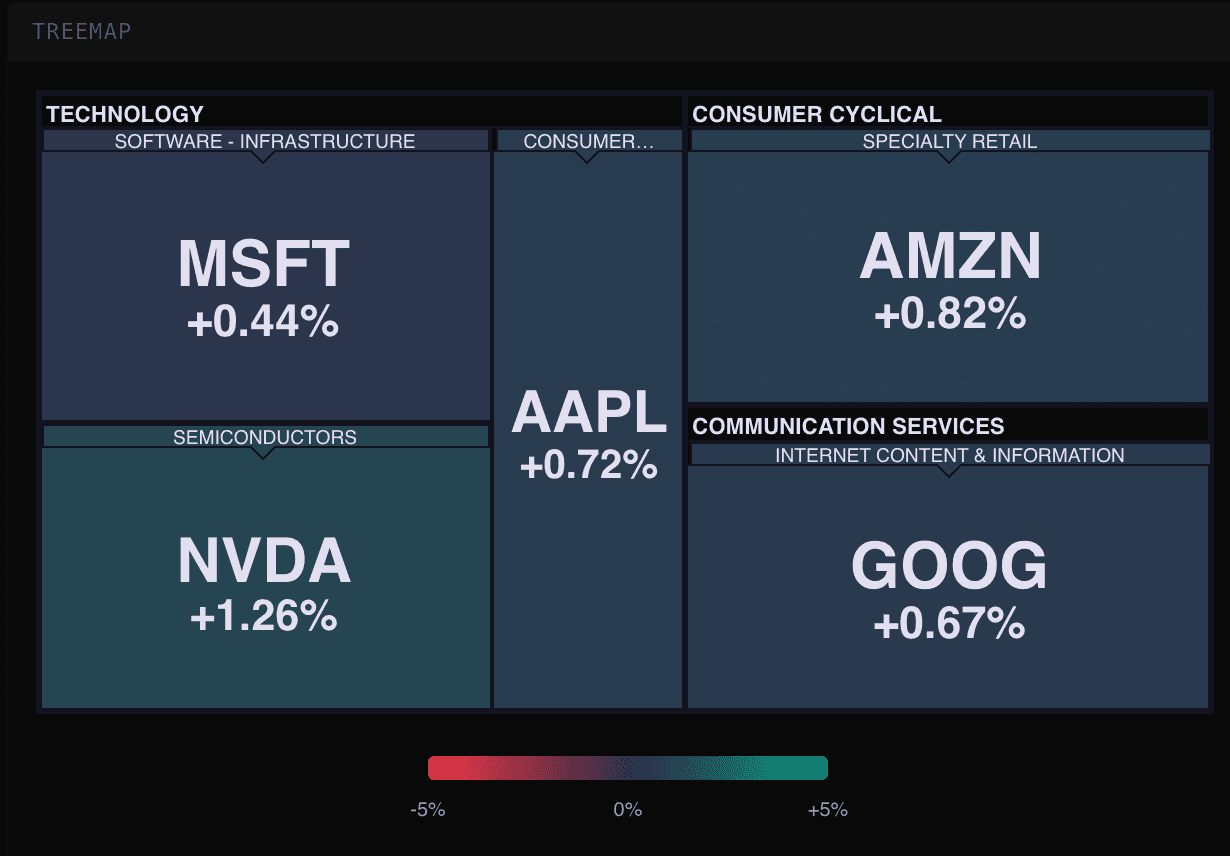
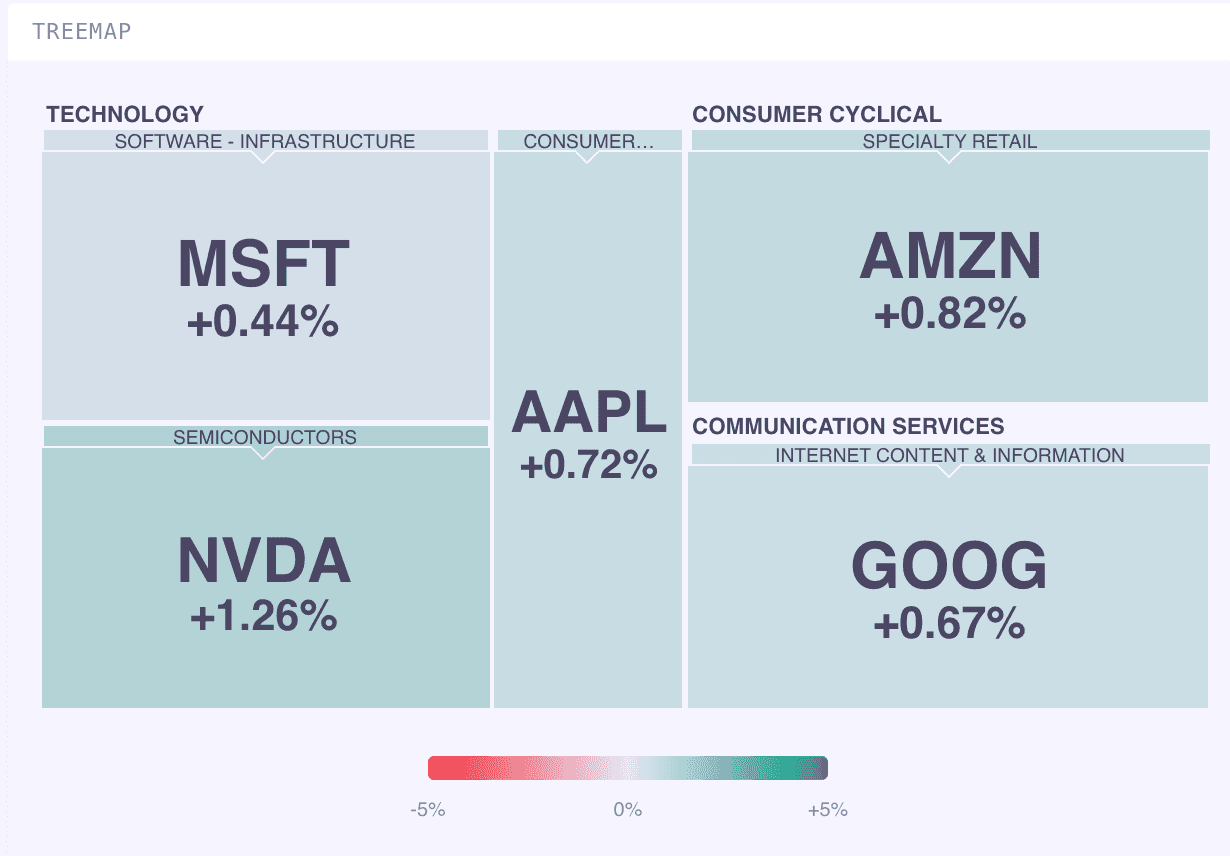
Sector Treemap
Live-updating treemap sized by market value and colored by daily performance.
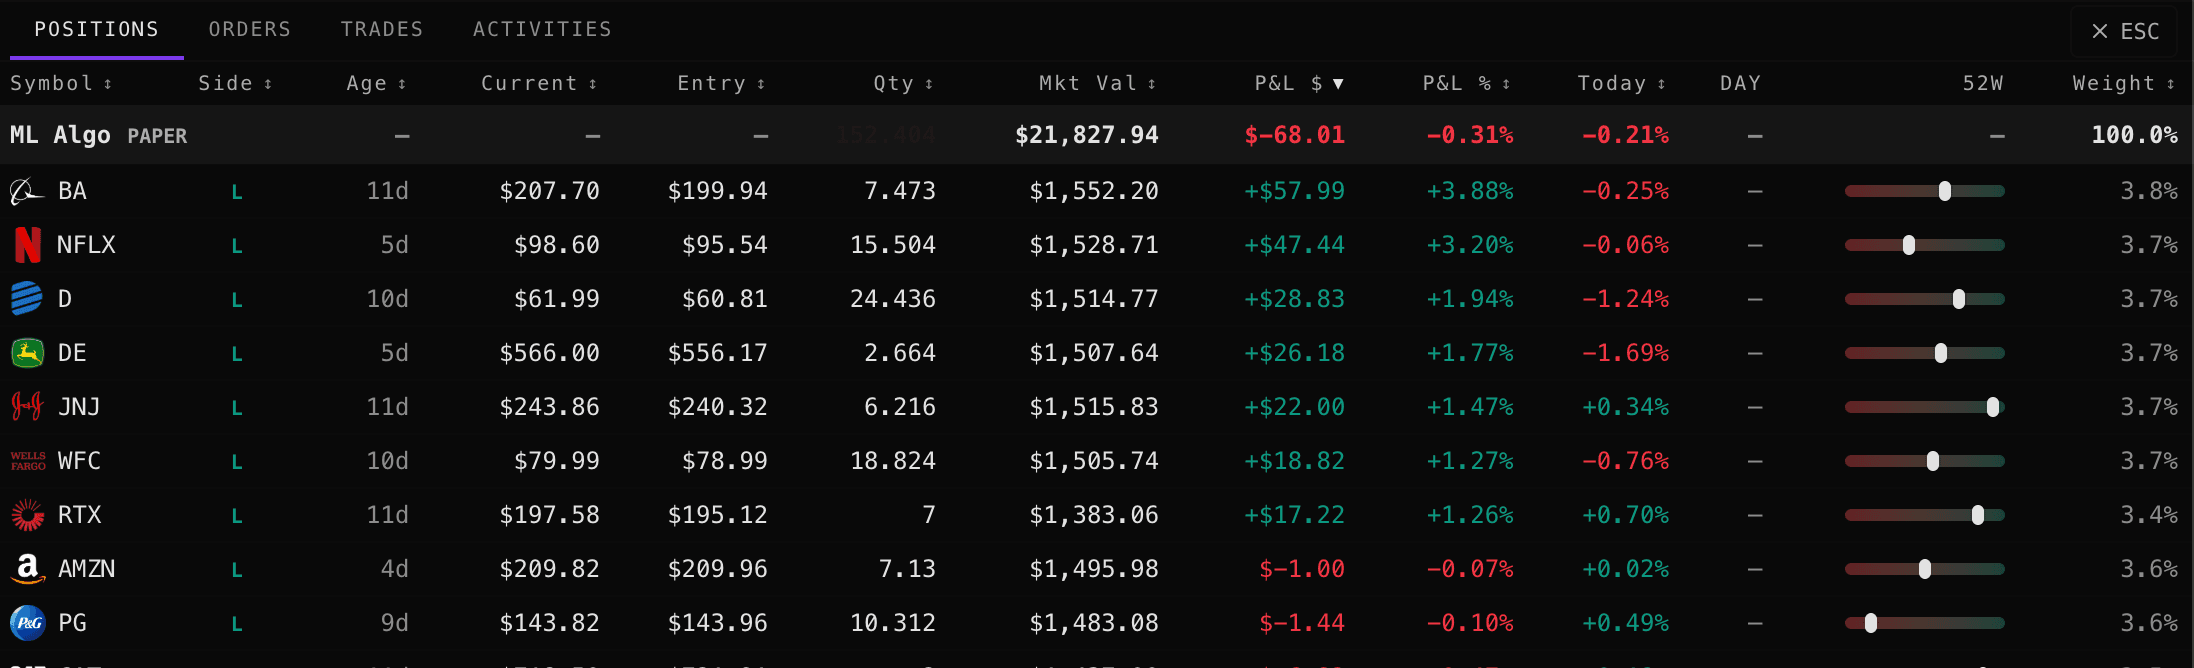
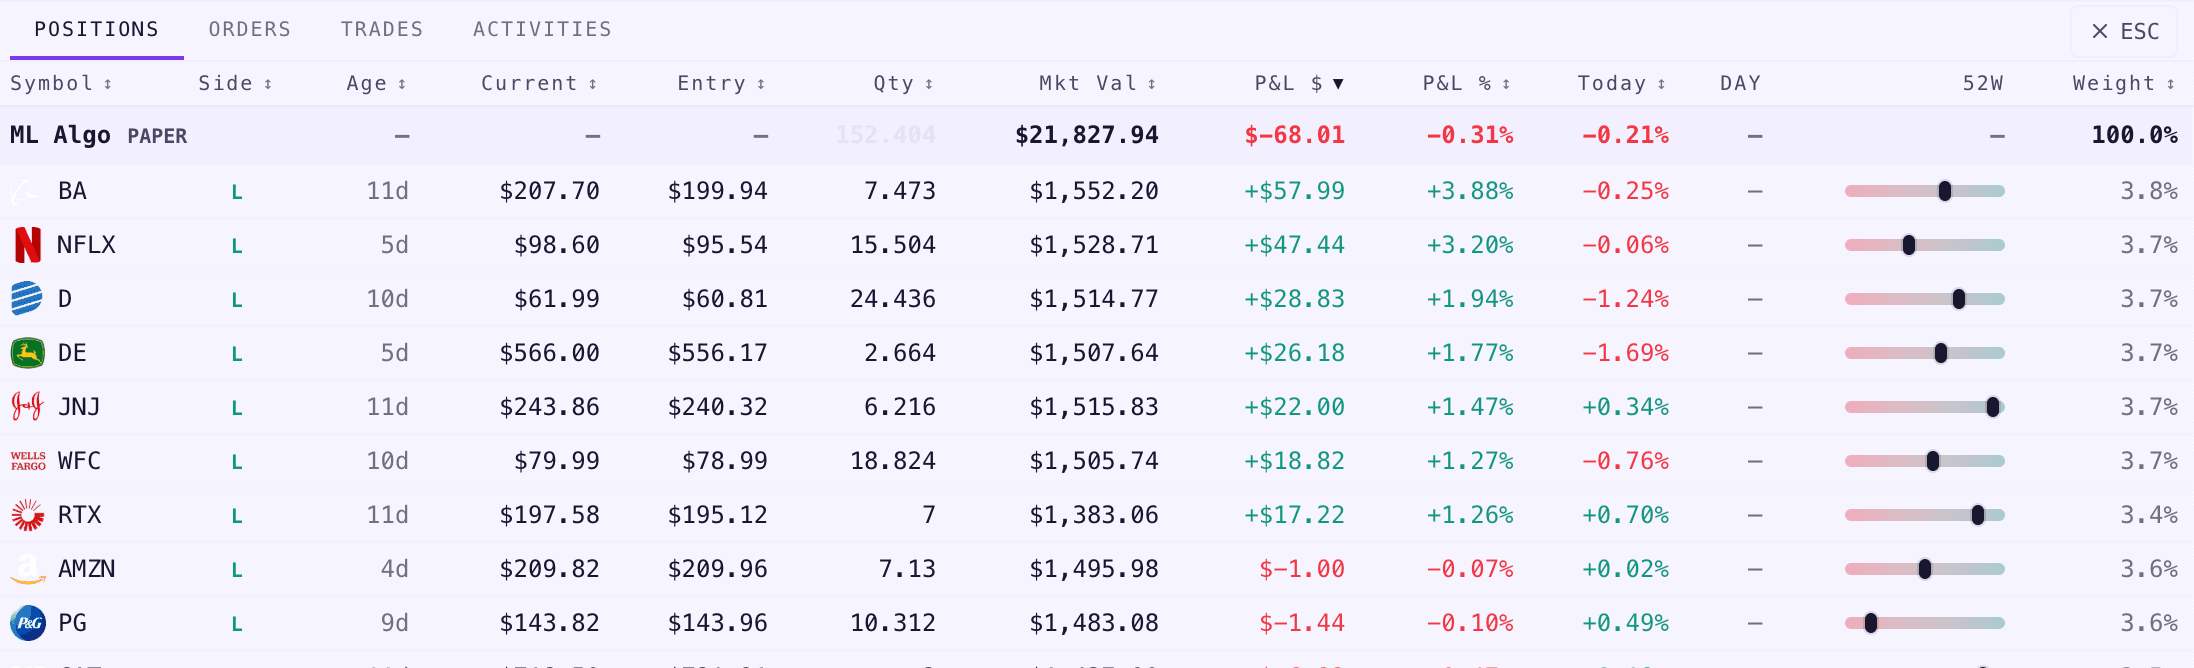
Every position, every account
Track holdings across every connected brokerage in one view — with live quotes.
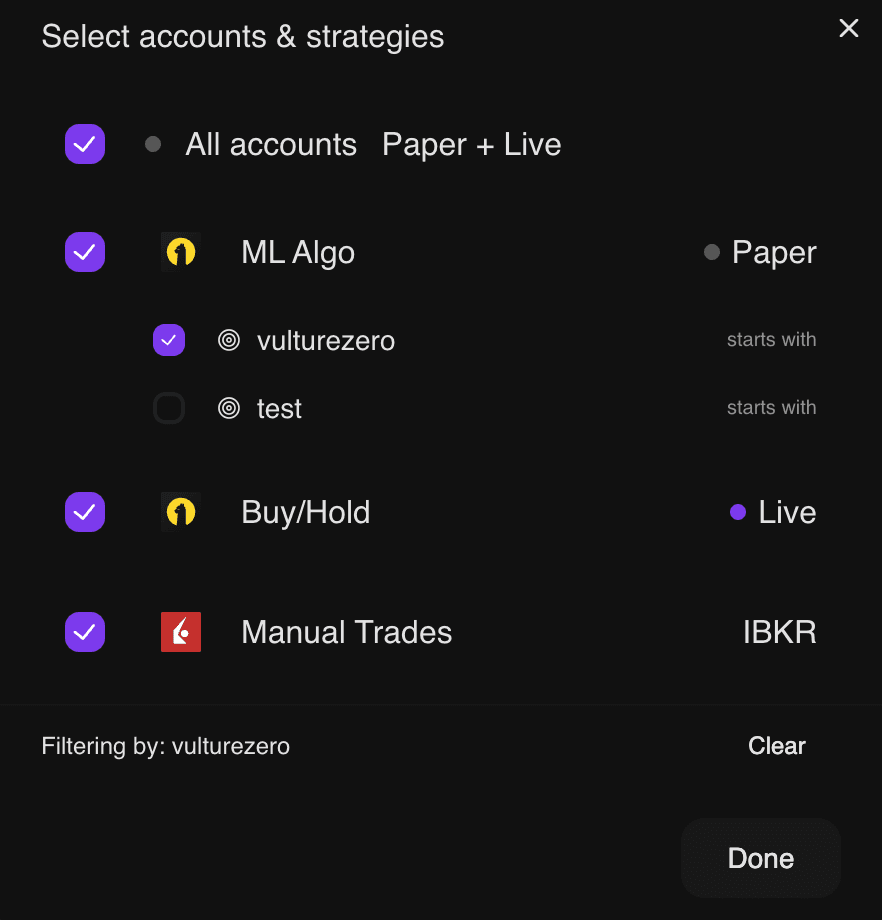
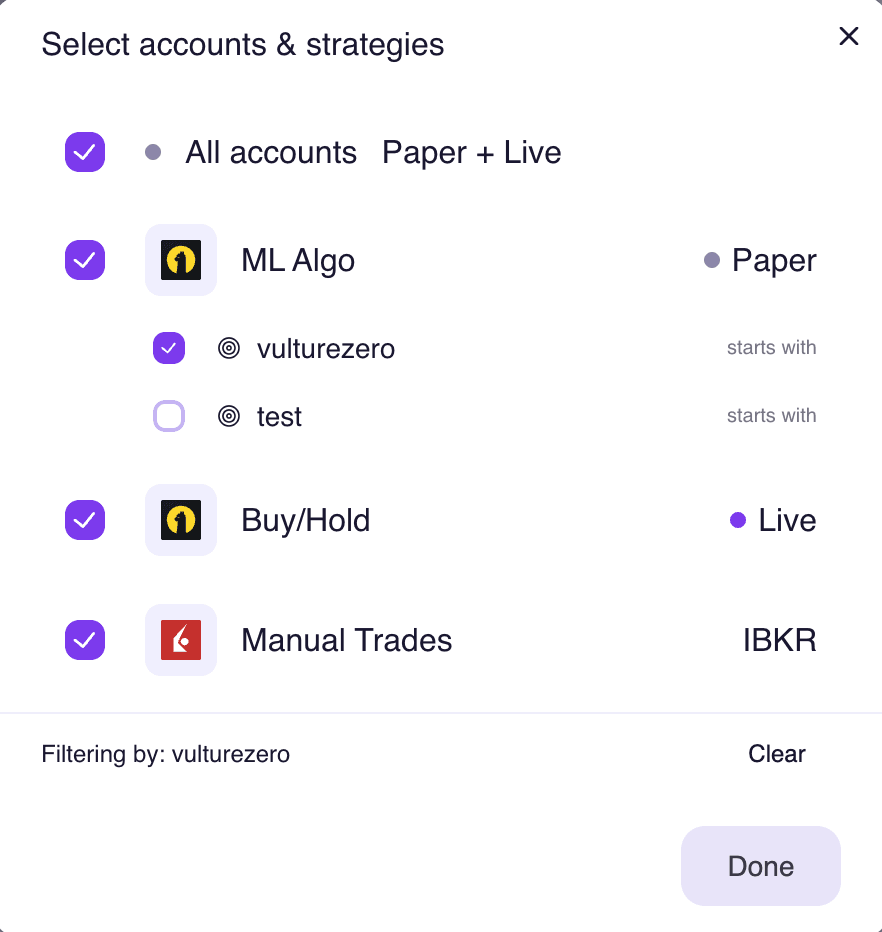
Multi-broker, multi-strategy
Connect paper and live accounts across brokers. Filter by account or drill into individual strategies.
- 01Select which accounts to include
- 02Filter by strategy for granular analysis
- 03All metrics update instantly across every chart
Up and running in minutes
Three simple steps to unlock your full portfolio analytics.
Create your account
Sign up in seconds with just your email and password.
Connect your broker
Link your brokerage in one click. We encrypt and store credentials securely.
Get deep insights
Instantly access risk metrics, benchmarks, heatmaps, and analytics your broker doesn't offer.